Blogged Answers: How I Estimate NPM Package Market Share (and how Redux usage compares to other libraries)
This is a post in the Blogged Answers series.
Introduction 🔗︎
For the last couple years, I've thrown around the statements that "Redux is used by 45-50% of React apps", and "Redux is by far the most widely used state management tool for React apps".
I've had a couple people ask how I'm coming up with those numbers. I'd written a couple prior comments about this - I tried to estimate React "state management market share" in Feb 2021, and talked some about the flaws in NPM stats as a metric in Feb 2022, but figured it was worth putting into a blog post for posterity.
I'll go through the sources I use, discuss the many caveats and limitations with those sources, and then look at Redux and other state management libraries as an example.
Primary Source: NPM Package Download Stats 🔗︎
The most obvious source, and the one that everyone including myself automatically turns to, is NPM's stats on how many times a package is downloaded.
That info is available through several different pages and aggregators.
NPM Package Stats Sources 🔗︎
NPMJS.com 🔗︎
The first is NPM's standard package description page. This shows a "downloads per week" graph in the right sidebar:
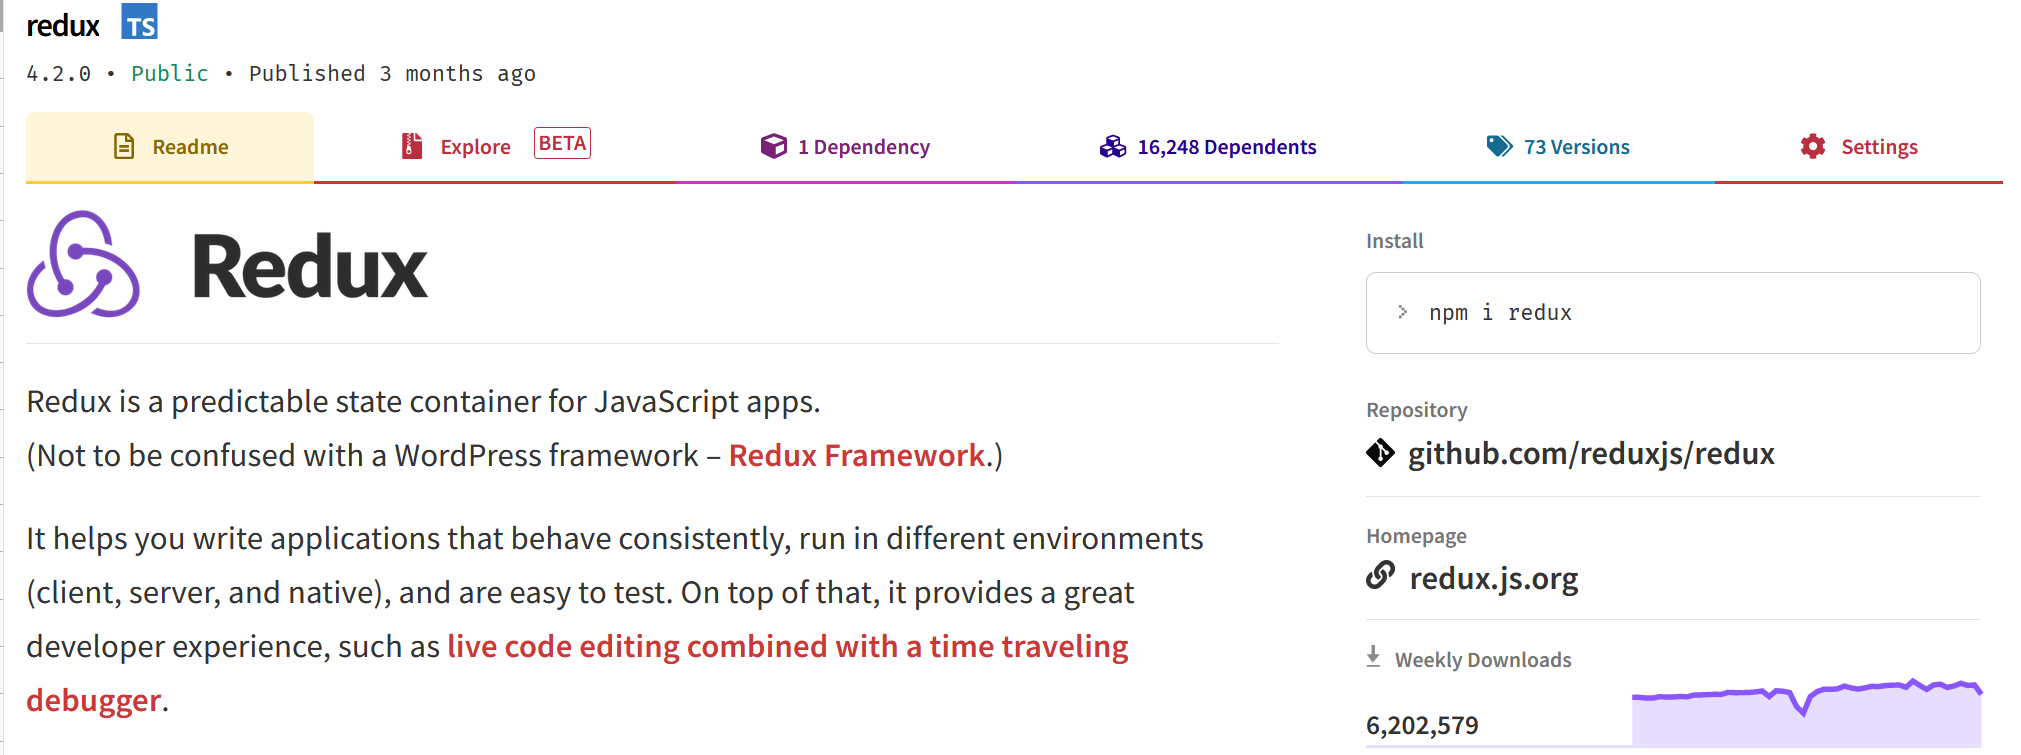
Until recently, there was no way to know how many times a given package version was being downloaded. Those weekly numbers count all versions of the package combined.
But, within the last year, NPM fiiiinally started publishing download stats per version. The limitation is that the data is only provided for the last 7 days worth of downloads.
Those per-version numbers are available on the "Versions" tab for a package on the NPM site:
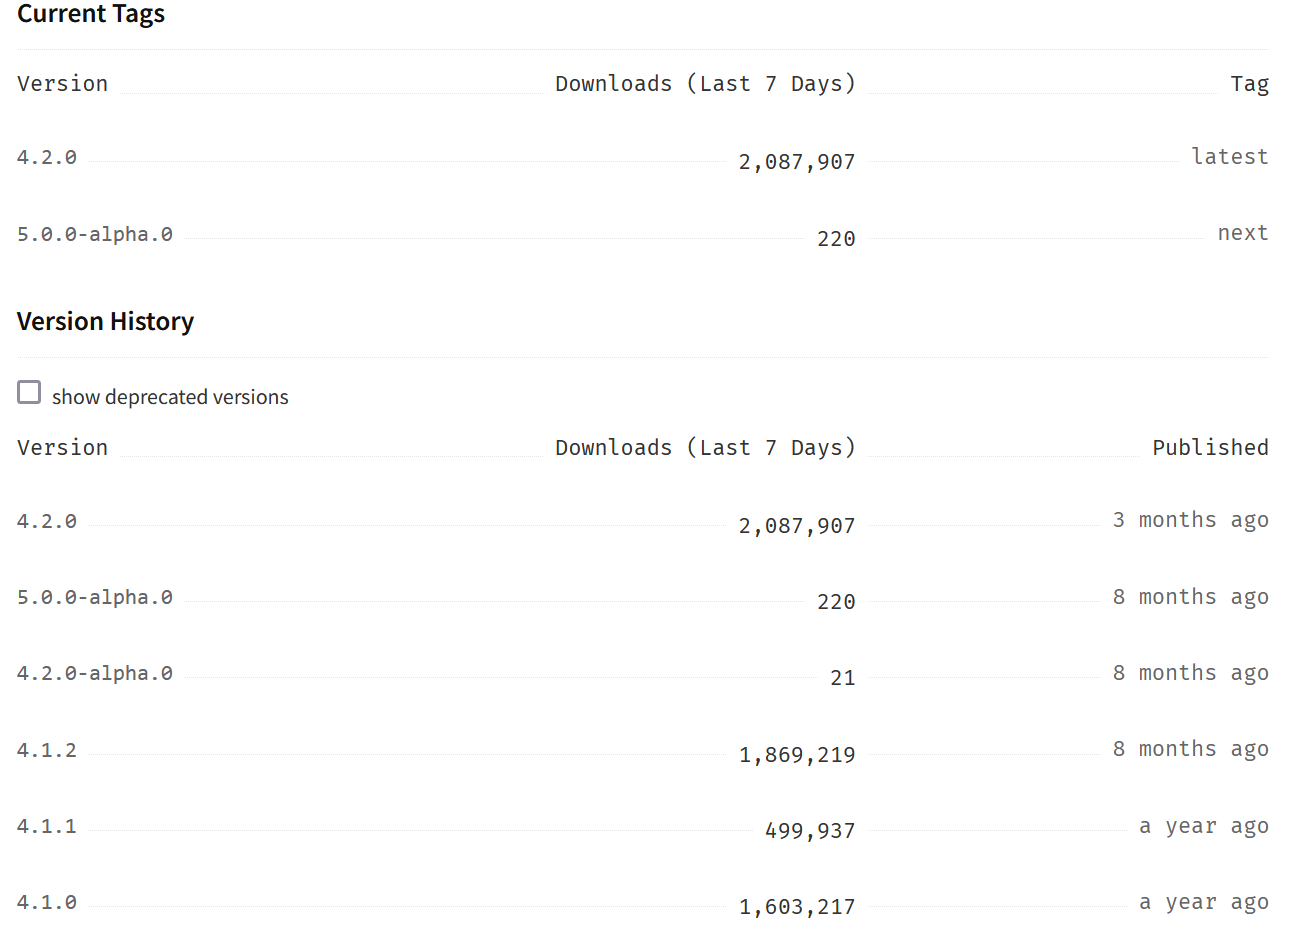
Happily, these per-version numbers are also available as an API, with a URL of https://api.npmjs.org/versions/$PACKAGE_NAME/last-week, such as https://api.npmjs.org/versions/redux/last-week :
{
  "package": "redux",
  "downloads": {
    "4.1.0-alpha.0": 48,
    "4.1.0": 1603217,
    "4.1.2": 1869219,
    "4.1.1": 499937,
    "5.0.0-alpha.0": 220,
    "4.2.0": 2087907,
    "4.0.0": 114988
  }
}
(Note: It would be really neat if someone would create a tool that would start automatically scraping these per-version downloads stats and save them to allow comparisons over time...)
NPM Download Comparison Tools 🔗︎
There's several sites out there that let you type in a few different package names, and it will query NPM for download stats over time and graph them.
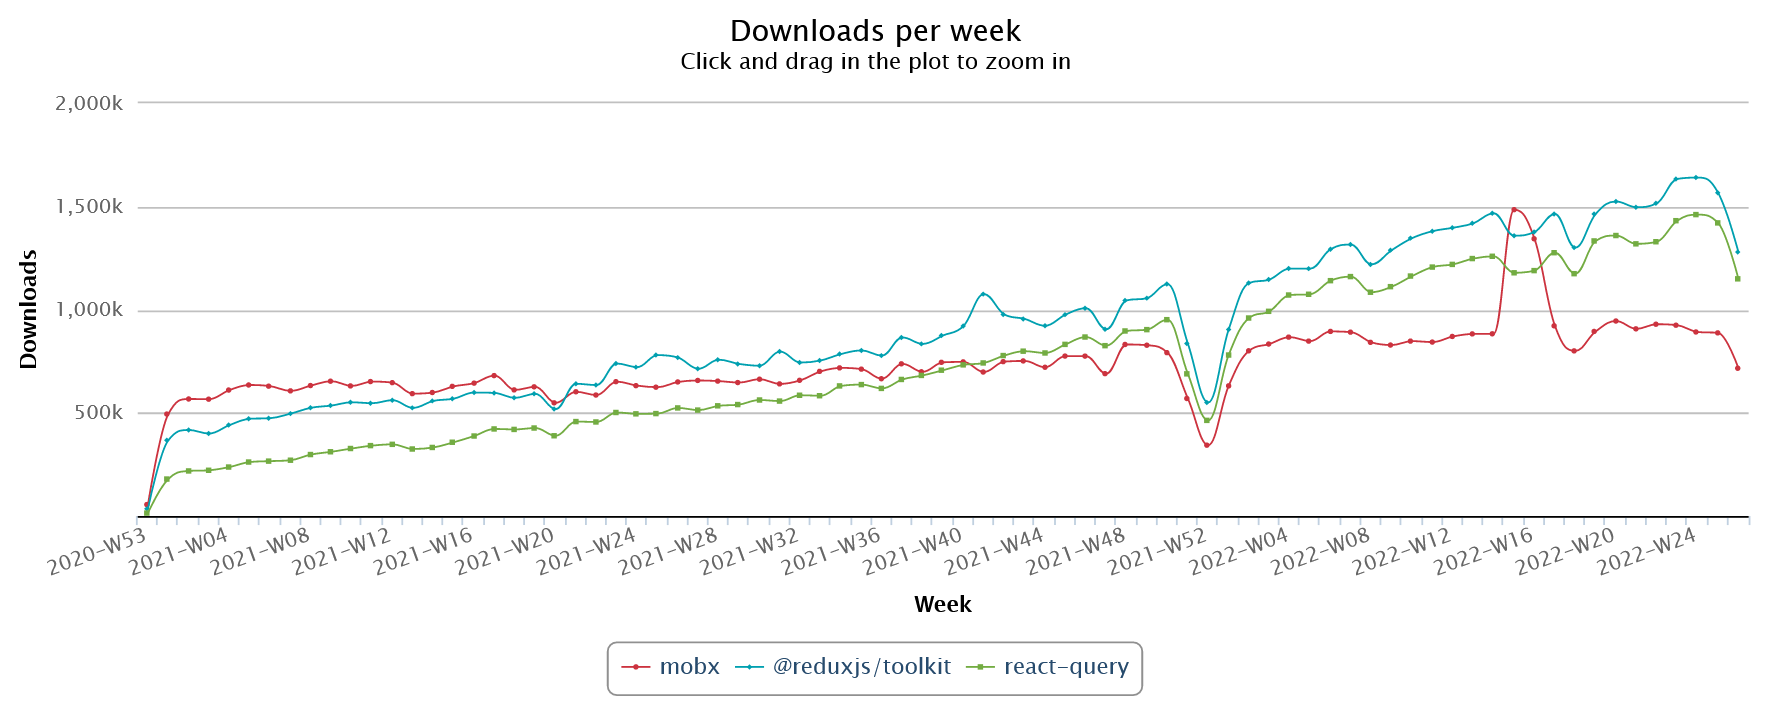
My go-to site is https://npm-stat.com. It lets you enter up to 5 package names (although I wish it allowed more), and shows graphs for daily/weekly/monthly/yearly download trends. Here's an example weekly graph from a query for Redux Toolkit, Mobx, and React Query since 2021:
Other available sites are https://npmtrends.com , http://npm-stats.org/, and https://npmcharts.com/ .
I also have seen https://moiva.io/ , which lets you do some similar NPM download stat trend comparisons for selected libraries, and also shows a variety of other stats: month-over-month download growth, recent releases, number of contributors, Github stars, bundle sizes, and more. A typical comparison page looks like this: https://moiva.io/?npm=@reduxjs/toolkit+mobx+react-query+redux+xstate
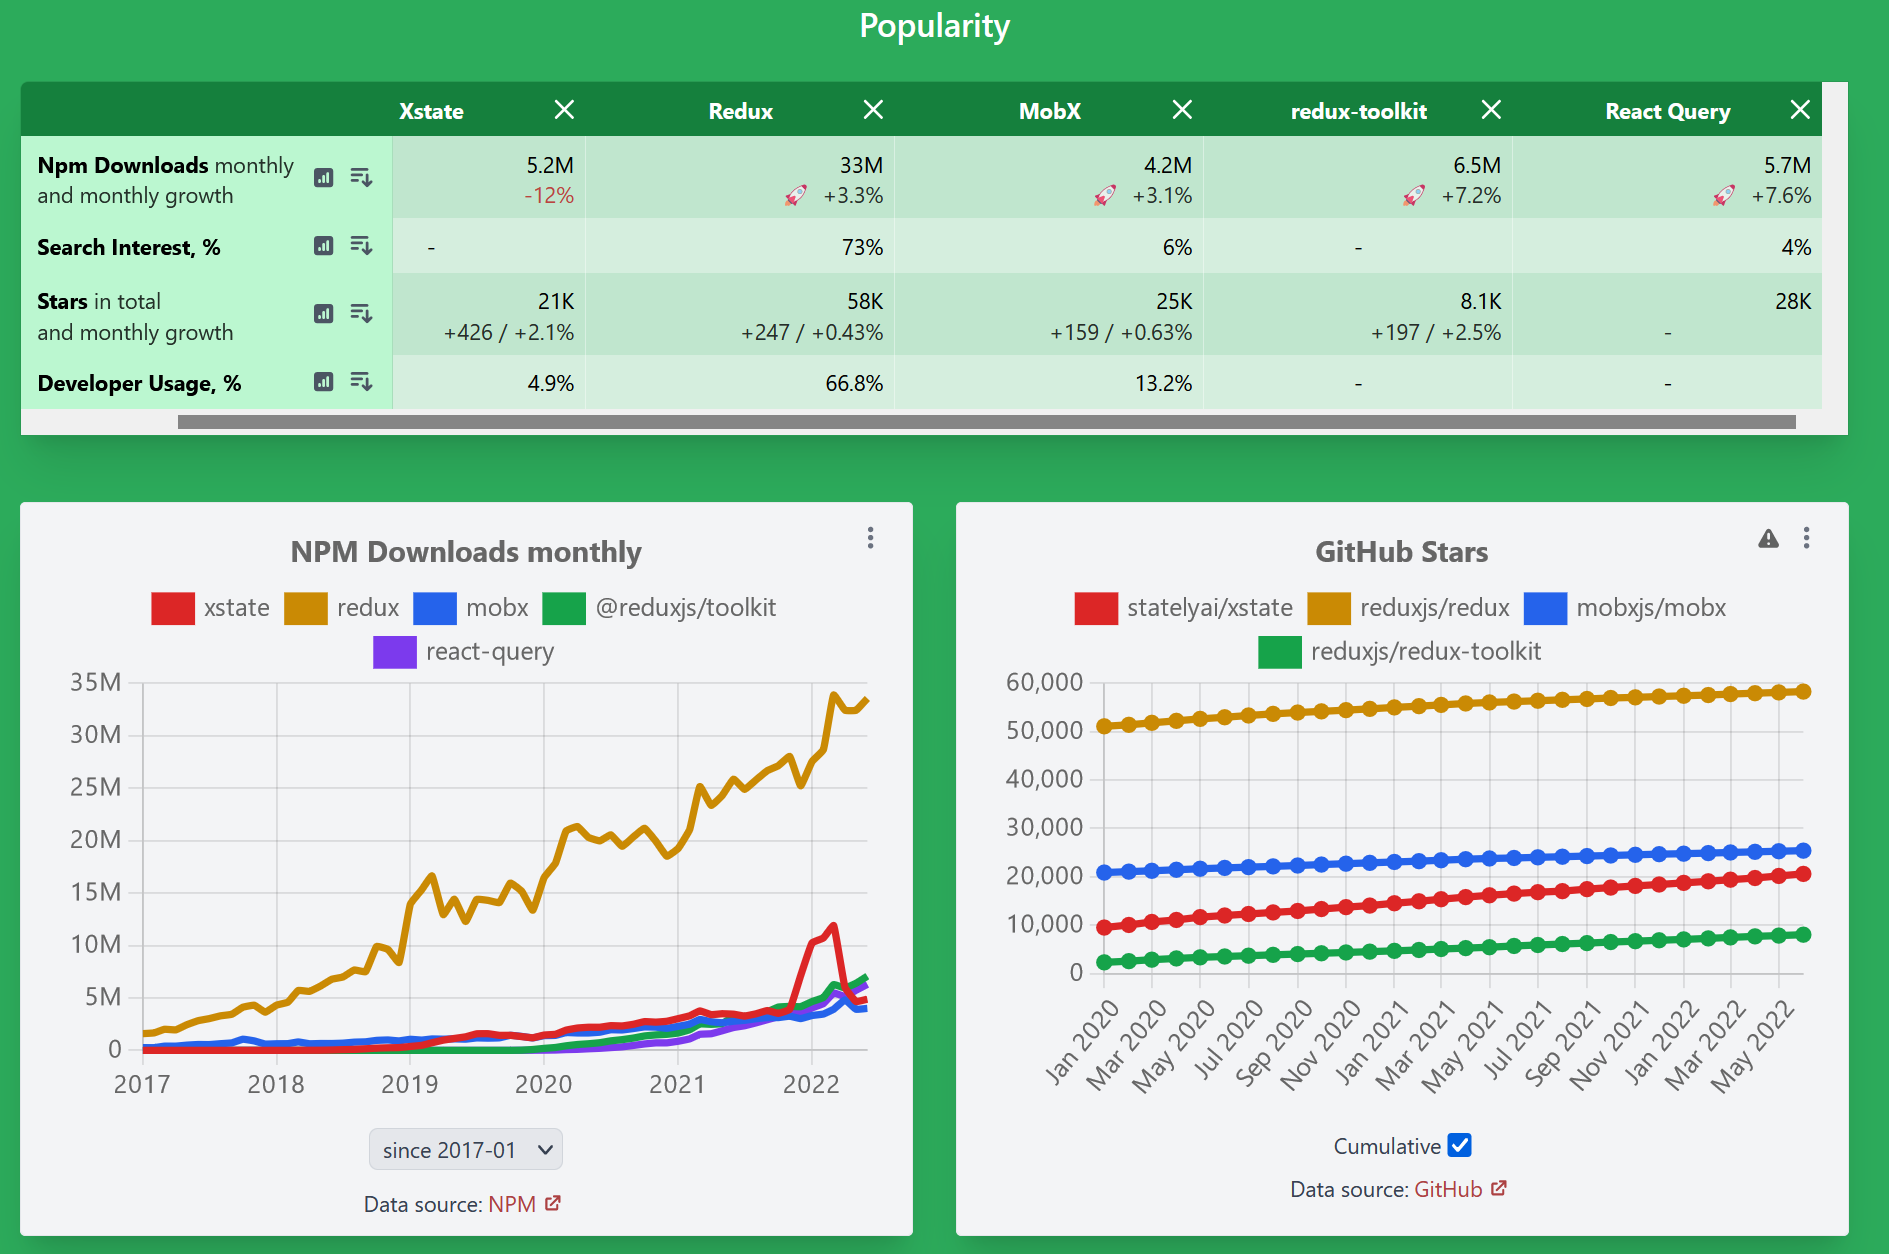
I haven't actually used Moiva that much thus far, but looking at it again now there's a lot of good info here and I ought to refer to it more often.
Alternate Stat Sources 🔗︎
There's a couple other actual stats sources I look at as well.
Github Dependency Lists 🔗︎
Github knows how to parse all the various package manager formats used in different language ecosystems, and uses that for many different features. One of those is the "Dependency Graph > Dependents" list, buried under the top "Insights" tab. It shows a count of how many repos and ecosystem packages depend on the package in this repo:
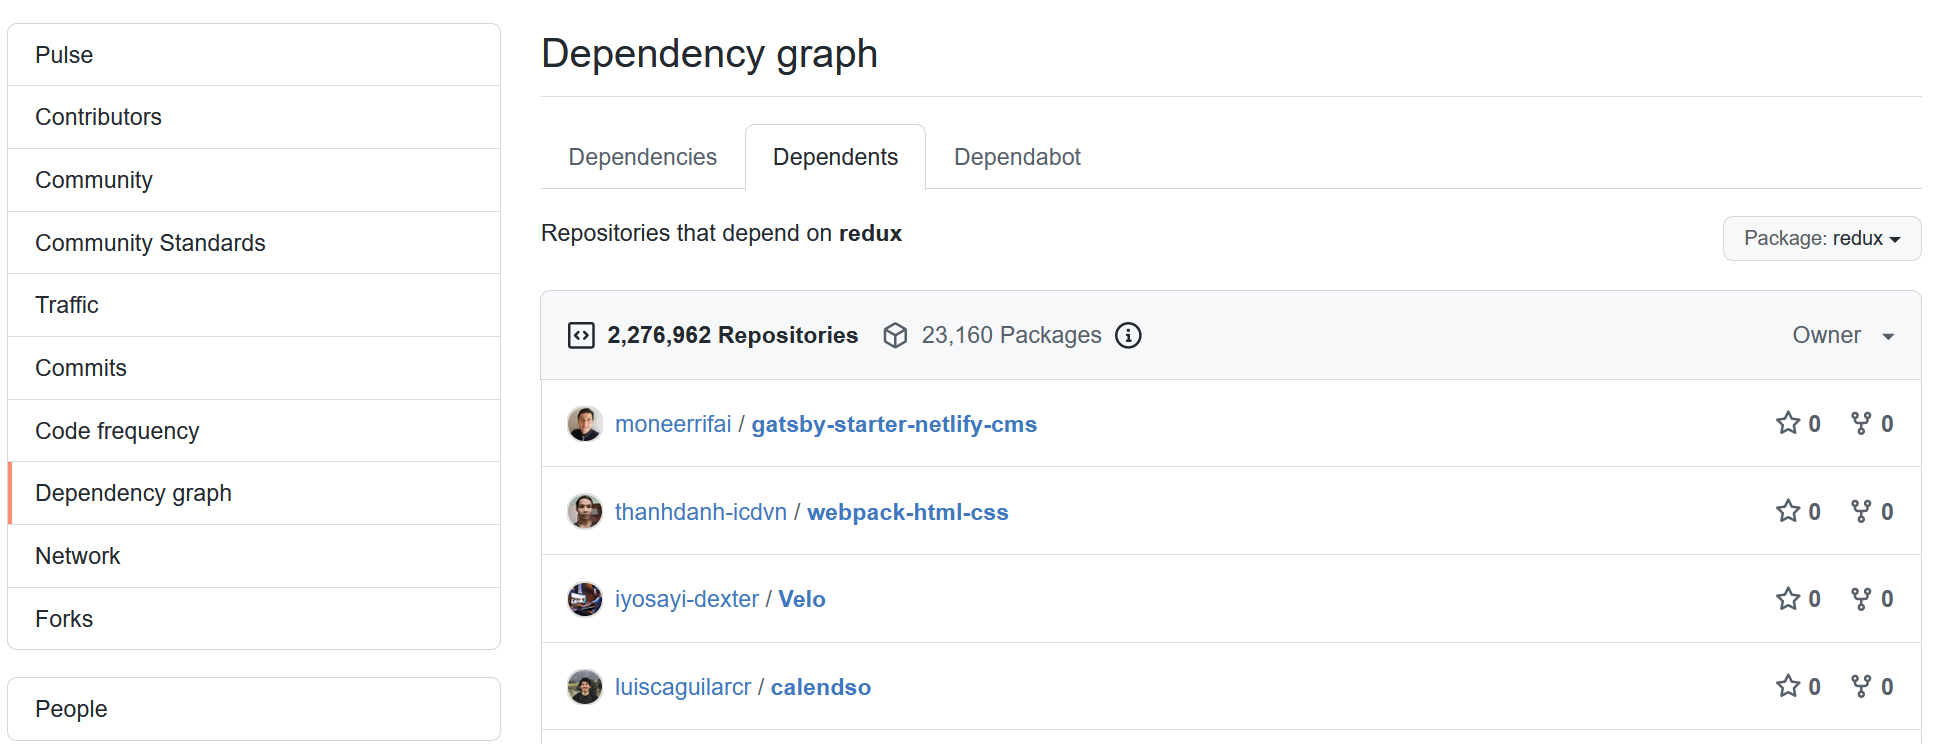
There's also Github stars. Frankly, I've never bothered using them as a proxy for actual usage, only vague popularity scales ("this just got posted", "a few people have looked at it", "this is actually being used", "this is widely used", "this is a major player in the ecosystem", etc).
Online Polls and Social Media Discussions 🔗︎
The other vaguely statistical values I refer to are the occasional "what tools are you using?" polls that pop up on Twitter or Reddit, and particularly in relation to state management libraries. These produce some actual numbers in the poll results, as well as associated discussion. A few examples:
These are a much less objective set of numbers, but looking at both the poll numbers and discussion can help give a sense of what's being used. On the other hand, polls are also inconsistent in which tools they even list in the first place, which makes them harder to compare to each other.
Similarly, it's not actual hard stats, I do get a sense of what people may be using or finding interesting from general chatter on social media: Twitter, Reddit, HN, Reactiflux, etc.
Caveats with Package Stats and Sources 🔗︎
Settle in, because there's a lot.
Every single one of these metrics and sources is horribly flawed in multiple ways!
NPM Download Stats Flaws 🔗︎
Let's start with the biggest source.
The first issue is what's even triggering all these downloads in the first place. Per Laurie Voss, who co--founded NPM:
They are mostly CI machines. Since package lock, updates don't really cause download spikes any more. The overwhelming majority of downloads are builds, not individual developers.
This brings up a lot of questions and possible influences on these numbers:
- A team with a bunch of CI jobs that keep redownloading the same packages is going to have an outsized influence on the absolute number of downloads
- There's very clearly a long tail of downloads for older versions that hang around indefinitely, so older packages seem to have a sustained base of download size. So, how many of these are for old versions vs new versions?
- The NPM download stats don't account for internal package hosting/caching servers like Artifactory or NexusRepository. For example, I used to work on a team that used an internal NexusRepo instance that caches packages, so none of our usage would ever get counted publicly.
- What about scripts hosted on a CDN? One of Vue's selling points is that it's very
<script>-tag friendly - For that matter, Vue is very popular in China, and there's a Chinese mirror of NPM (
cnpm) that I've heard is typically used by Chinese devs. Downloads from that won't be reflected in NPM's stats. - It's possible to game the numbers. I saw one package that had only been published for the first time a few days before, and yet it somehow spiked to over 1M+ downloads a day within the next couple days. Clearly impossible, and it's likely this was due to a bot of some kind faking downloads.
For that matter, NPM's own stats aren't always reliable. There have been times when NPM recorded 0 downloads for a widely used package for a few days, or other times when there's a giant spike in downloads that can't possibly be real. For example, NPM claims that downloads of XState somehow tripled for a couple months before going back to normal, and downloads of Mobx went up by 75% for two weeks:
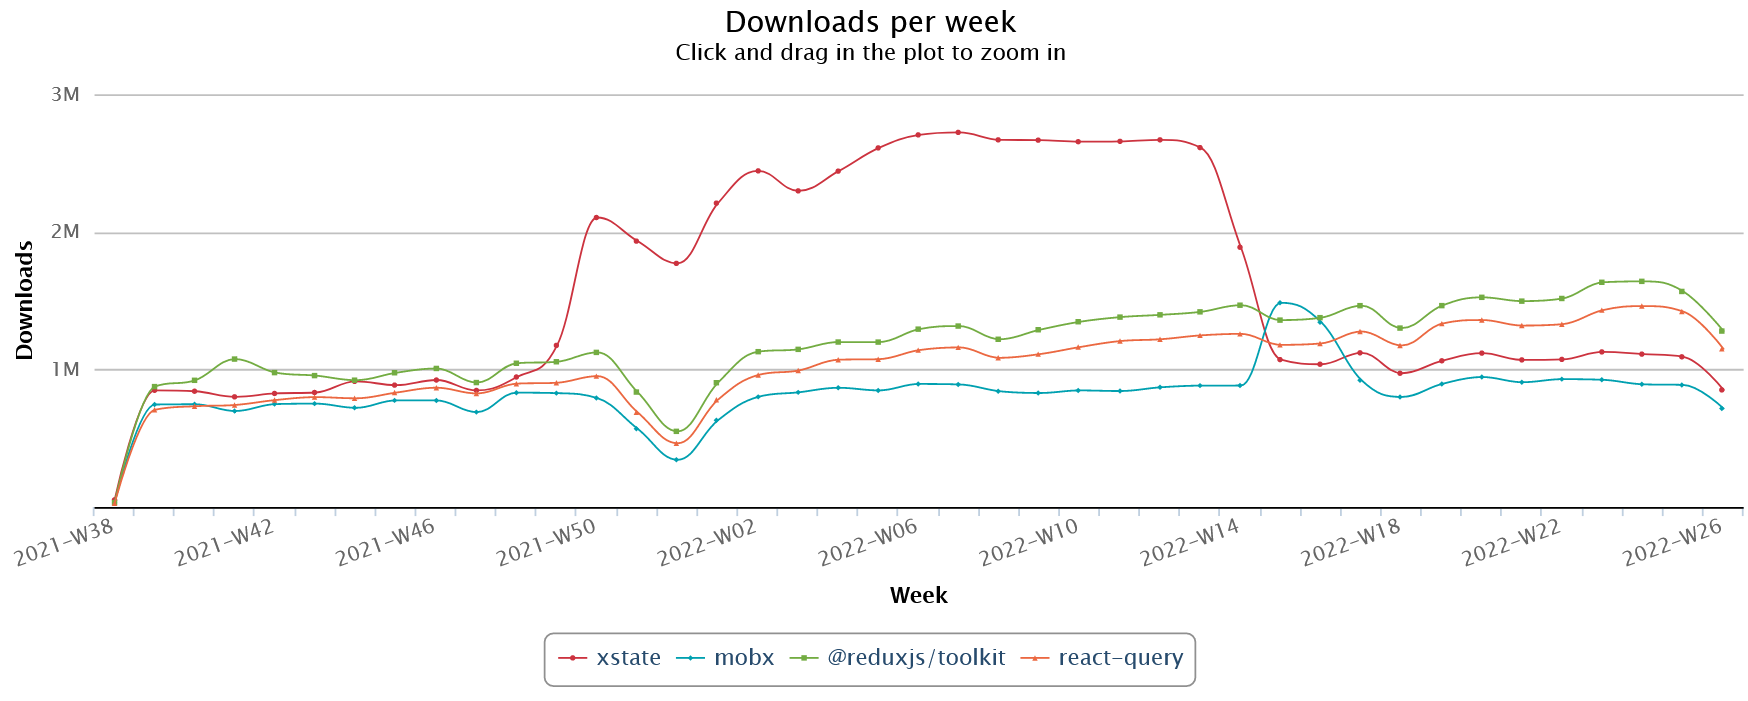
Given the consistent download levels before and after those periods, the spikes in numbers should be ignored as outliers.
Again quoting Laurie Voss:
They are meaningful relative measures -- a package with more downloads than another package is more popular -- but they have never meant anything as absolute numbers.
Laurie also covered this in a talk on the NPM registry in 2019.
As part of that talk, he described a metric called "share of registry", which points out that the absolute size of registry downloads is always growing. This means that a lib could experience an absolute increase in downloads, but its relative usage share could decrease. So, by checking "number of downloads for this package" vs "total downloads for all the registry" over time, you get a more normalized value.
I asked Laurie for some feedback on this post, and he reported that the NPM API offers the "total registry downloads" numbers for a given time range, such as https://api.npmjs.org/downloads/range/2015-01-01:2015-12-31 .
Sadly, I don't know if the "all registry downloads" numbers that Laurie used to generate that graph are available publicly, and even if they are that would take some work to pull together and calculate. So, us amateurs are stuck with just looking at the absolute values and guesstimating comparisons.
So, like I said, tons of flaws. But at the same time, NPM's download stats are basically the only hard objective numbers we as a community have to look at and infer actual usage numbers in any way. So, to some extent we end up having to look at those and make inferences, however flawed they might be.
Other Caveats and Concerns 🔗︎
I have no idea whether that Github "Dependents" list counts private repos. My guess is that it doesn't.
Any kind of an online poll is statistically meaningless - there's no guarantee of who saw it, who chose to answer, etc, and there's a lot of ways you could answer. What if I use Redux for my day job, and Mobx when I work on a side project at home? What answer would I choose?
What does "usage" mean anyway? :) Does 30 clones of a starter kit/boilerplate count as exactly 30 times as many "usages" as a team working on a single large project for multiple years? What about a project that pushes to CI dozens of times a day and rebuilds from scratch every time?
For the case of "React state management" specifically... React has its own built-in component state handling. There's no way to measure how much that's being used as the sole state management tool, beyond trying to somehow subtract "downloads of all state libs" from "all React downloads".
Estimating React State Management Market Share 🔗︎
So having just listed a ton of ways that this process is flawed and hopeless, I'm now going to turn around and try to use it anyway :)
I'm going to walk through some of the steps I go through to come up with estimates of "React state management library" market share. This is largely because it's the area I'm most familiar with, but also frankly it's the area that seems to come up the most :) (although my perception here is also affected because I'm active in the React community and the maintainer of Redux, so of course this is a topic I would seem to see frequently.)
I'm going to compare Redux and RTK vs Mobx, Zustand, XState, and React Query, and also toss in a second set of comparisons with Recoil, Jotai, Valtio, and Mobx-State-Tree. (It would be interesting to add in Apollo, SWR, and Urql as additional data fetching libraries, but c'mon I can only put so much time into this blog post :) )
Now, I know that these are actually somewhat different libraries - React Query isn't "client state management", but given that it has a somewhat similar usage rate to Redux Toolkit (and folks sometimes migrate from Redux to React Query to manage server state), it often gets thrown around by people as a competitor.
Comparing NPM Stats 🔗︎
Generally, my first step is to go to https://npm-stat.com, type in the name of several libraries, and view stats for the last couple years. This starts to give us a sense of scale and relative comparisons.
For example, here's Redux Toolkit, Mobx, XState, React Query, and Zustand since the start of 2020:

But what happens when you do RTK, Redux core, React, and React-Redux?
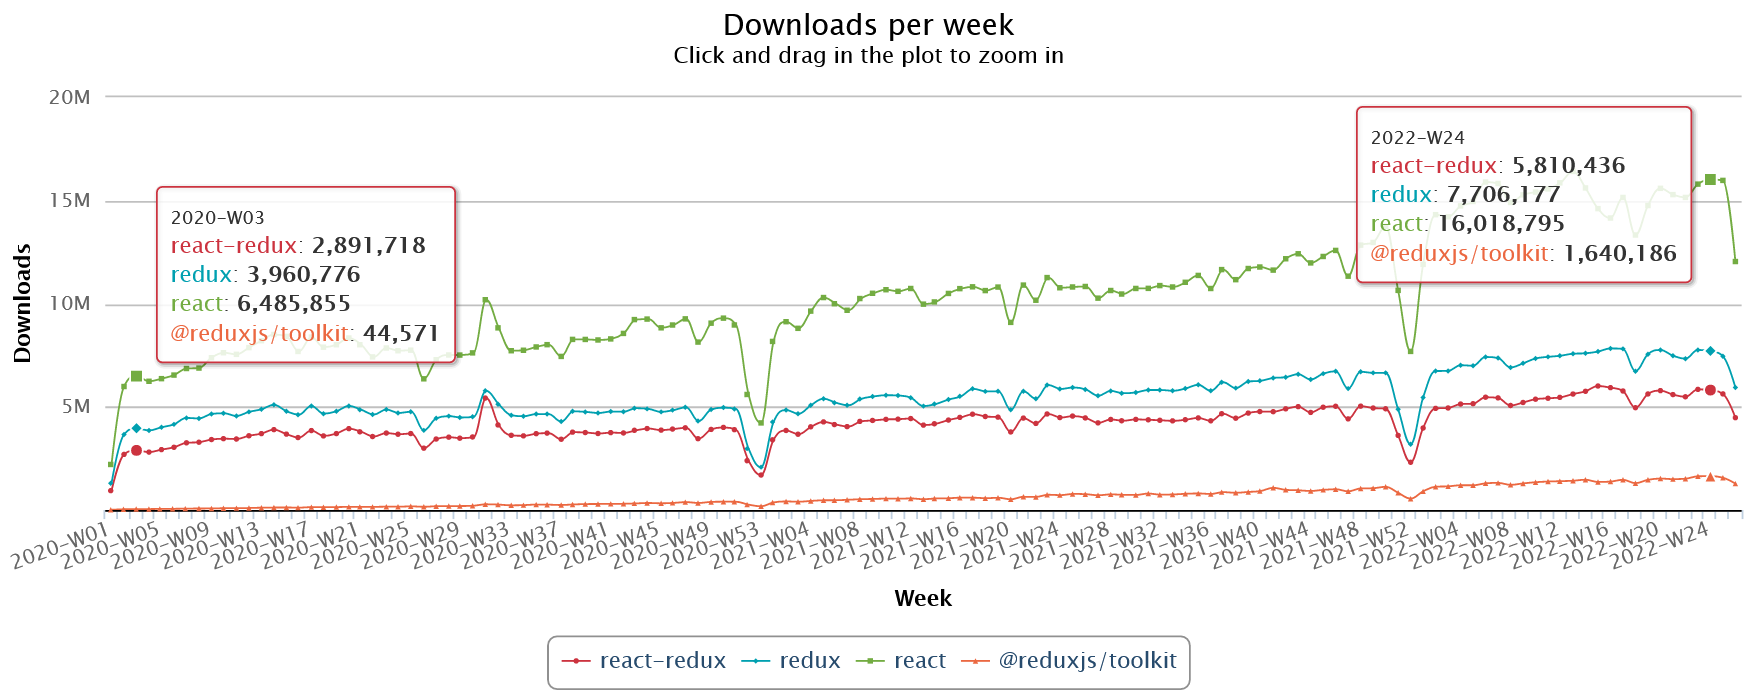
So, both relative growth rates and sense of scale and magnitude are useful pieces of info here.
For additional comparison, here's RTK vs several other libraries:
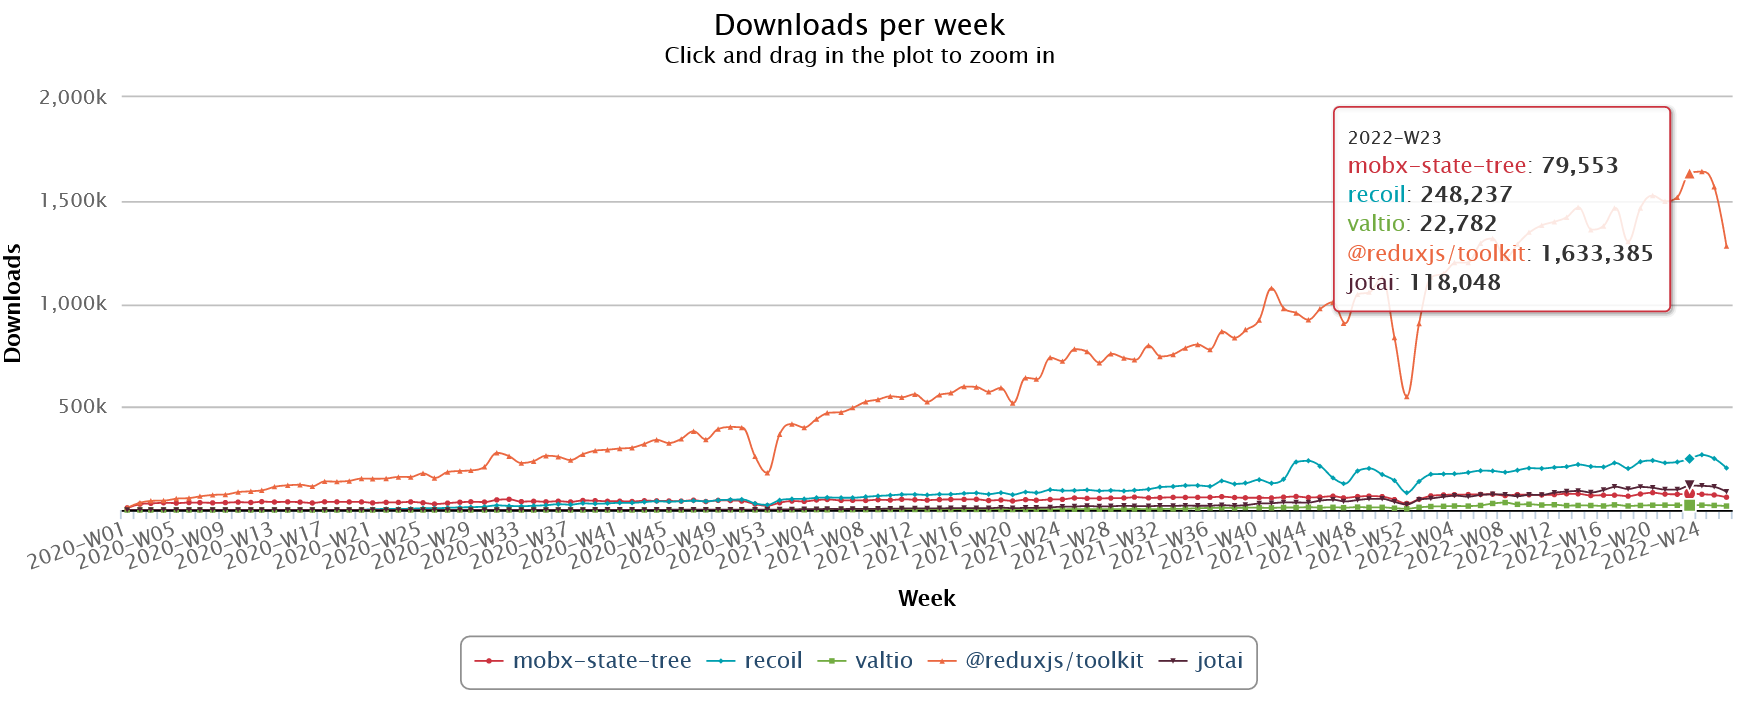
Pulling out some of those numbers:
- React: 16.0M
- Redux: 7.7M
- Redux Toolkit: 1.64M
- React Query: 1.46M
- XState: 1.11M
- Mobx: 891K
- Zustand: 550K
- Recoil: 267K
- Jotai: 117K
- Mobx-State-Tree: 76K
For point of reference, when I did a similar comparison in Feb 2021, the numbers were:
- React: 9.5M
- Redux: 5M
- Apollo: 1.3M (combined across @apollo/client and react-apollo)
- XState: 750K
- MobX: 600K
- Redux Toolkit: 450K
- React Query: 250K
- SWR: 250K
- Recoil: 60K
- Zustand: 40K
(Yes, I realize there's some differences in which libs are in each list.)
What can we learn from these graphs?
- Clearly the Redux core package has vastly more downloads than any of the other state libs
- RTK has passed Mobx and XState
- Remember that RTK has a hard dependency on the
reduxcore, so all RTK downloads are also Redux downloads - React Query has really taken off in the last year, and is gaining downloads at a slightly faster pace than RTK
- React-Redux has almost as many downloads as the Redux core, which means that most Redux users are using React
- React-Redux has historically been in the vicinity of 45-50% of React downloads, but React's growth rate has accelerated in the last two years.
- Redux and React-Redux are seeing growth in absolute terms, but not as much as React.
- I'm actually a bit surprised that the download rates for React-Redux and Redux core have started to diverge a bit - perhaps we're getting more non-React users?
- Zustand has seen quite a bit of growth
I have to say some of the results here kind of surprise me. Given the hype around Recoil early on, you'd think that it would have more usage. RTK seems to be actively growing, while the other libs are seeing very slow growth. (Also remember that we're at the "smaller state libs" scale, and the "React and Redux" scale dwarfs any of these.)
Comparing Github Dependents 🔗︎
I just now went through the repos for all these libraries, and manually looked up the stats on the "Dependents" page for each repo, and have them sorted by the "number of repos using this package" count:
| Library | Repos | Packages |
|---|---|---|
| React | 10,614,469 | 231,415 |
| Redux | 2,279,295 | 23,163 |
| React-Redux | 2,117,795 | 18,916 |
| Redux Toolkit | 275,624 | 1,635 |
| XState | 133,285 | 633 |
| Mobx | 106,102 | 4,585 |
| React Query | 75,383 | 919 |
| Zustand | 30,465 | 481 |
| Recoil | 26,159 | 369 |
| Mobx-State-Tree | 6,829 | 360 |
| Jotai | 4,065 | 170 |
| Valtio | 1,612 | 106 |
Some thoughts here:
- It's amazing to see the scale of React itself. It just dwarfs everything else
- There's a very interesting difference in ratios between the NPM download stats and the Github repo dependents stats. Redux is just about 50% of React in terms of downloads, but just barely over 20% in terms of repos.
- Redux and React-Redux are much closer in terms of repos than downloads, although perhaps Github doesn't count RTK-using repos as depending on
redux, in which case their relative ratio widens a bit
Poll Results 🔗︎
Similarly, I'm going to go through some of those polls I linked earlier and pull out the numbers for libraries over time:
| Library | Twitter 2019-10 | Reddit 2020-11 | Reddit 2022-02 |
|---|---|---|---|
| Redux | 48% | 42% | 67% |
| Mobx | 9% | 4.5% | 5.8% |
| Context | 32% | 25% | |
| React state | 22% | ||
| Recoil | 4% | 6.3% | |
| Unstated | 2% | ||
| Zustand | 12.5% | ||
| Jotai | 4.4% | ||
| XState | 3.4% | ||
| "Other" | 11% |
Clearly there's a lot of inconsistency here in terms of which libs are even being voted on, much less which ones are being used, plus there's a split between "using React state" and "using a library". So, we definitely can't use these for real meaningful statistical comparisons, but you can still get a vague sense of usage here. The main takeaway I would get out of this is that, yes, Redux is still pretty strong here, and there's a lot of split beyond that.
Conclusions 🔗︎
Looking at these numbers now, with fresh eyes, here's my takeaways:
React's Growth Continues 🔗︎
I didn't do comparisons vs Vue, Angular, Ember, and Svelte here, but you can see by just looking at "React vs any other React ecosystem lib" that React is getting downloaded and used lot, and shows no signs of stopping.
Ironically, I did just pull up some links to framework-level usage comparisons based on similar statistics to answer a comment earlier, and they definitely do show React's lead. I'll link those here:
- https://gist.github.com/tkrotoff/b1caa4c3a185629299ec234d2314e190
- https://w3techs.com/technologies/comparison/js-angularjs,js-react,js-vuejs
- https://npmtrends.com/@angular/core-vs-react-vs-vue
Redux is Still Number One In State Management 🔗︎
Clearly, Redux is still by far the most widely used state management library with React apps. No other library comes close in terms of NPM downloads and dependent repos, and even Redux Toolkit by itself is beating the other libraries handily. Additionally, the anecdata of the polls and discussions shows a lot of people saying "use RTK", which is a noticeable change from 2018-2019 when a lot of folks were chattering about "Redux boilerplate" and "Redux is dead".
Redux's Total Market Share has Dropped vs React 🔗︎
I said at the start of this post that I've been repeating "Redux is 45-50% of React apps" for a while now.
Honestly, after seeing these numbers, I think I need to revise that at least partially.
If we look at just React, Redux, React-Redux, and RTK:
| Library | DLs/wk | Dependents |
|---|---|---|
| React | 15.97M | 10.61M |
| Redux | 7.45M | 2.28M |
| React-Redux | 5.62M | 2.11M |
| Redux Toolkit | 1.57M | 0.27M |
Based on NPM downloads, Redux itself is still around 45% of React, but React-Redux is only 35%.
Where it gets really different is in terms of dependent repos. There, Redux is only 20% of React.
To be honest, I'm really not sure what to make of the split between numbers here. If we go back to Laurie Voss's point that "NPM downloads are primarily driven by CI", I suppose some interpretations here might be:
- There's a ton of repos that depend on React, but not Redux. It's possible that a noticeable percentage of those are "starting to learn React" repos from beginners, and thus might be less likely to depend on Redux
- It's also very likely that a larger number of new apps today are indeed less likely to add Redux, because they don't feel it's necessary
- It's possible that larger professional apps may be relatively more likely to be using Redux, and thus installing it when building in CI
- Libraries that depend on React may also contribute to the number of React downloads
To be clear, I don't know if any of these guesses are correct! I'm just brainstorming right now as I look at these numbers, trying to come up with possible explanations.
If I were to revise my previous "45-50% of React" estimate... the obvious potential bounds here are 20-35%, depending on how you balance "downloads" vs "dependent repos".
On the other hand, as I asked earlier: how should we weigh "usage" between "thousands of starter app clones" and "real apps"? Raw numbers? Does 1 real app === 10/100/1000 starter clones? How would we even figure that out how many repos fit in those categories without completely scraping Github? :)
I'm going to try to be intellectually honest with myself here:
I'm going to revise my prior "45-50% of React apps use Redux" estimate, and lower it to "roughly 33% of React apps use Redux".
I think that's a fair-ish estimate based on the combination of downloads + dependents, tweaked by the anecdata.
Wishlist 🔗︎
It would be really nice if someone could put together a new NPM package comparison site that automates the "share of registry" metric for a given set of packages. Given that you can query for "all registry downloads" and "per-package downloads" for a given time range, this seems pretty feasible.
It would be nice if there was also a way to query Github's API for the "Dependents" info, but it doesn't look like that's available. I did find a Stack Overflow answer showing how to scrape that info from repo pages, so I guess that could be a fallback option.
Moiva.io seems like it does a good portion of that already, and there is an open issue to add dependents as a metric. I also just filed an issue asking for adding "share of registry" as a comparison metric as well.
Final Thoughts 🔗︎
Hopefully the info I've provided here is informative and useful for folks trying to make comparisons between different packages.
And yes, I did intentionally write this post to show some stats behind my repeated statements that "Redux is still most widely used" and "45-50% of React apps". Looking at these numbers, they definitely back up the "most widely used", but I did have to revise the "45-50%" down to about "33%" - I hadn't realized just how much the gap in downloads between React and React-Redux has grown in the last year.
This is a post in the Blogged Answers series. Other posts in this series:
- Aug 08, 2023 - Blogged Answers: My Experience Modernizing Packages to ESM
- Jul 06, 2022 - Blogged Answers: How I Estimate NPM Package Market Share (and how Redux usage compares to other libraries)
- Jun 22, 2021 - Blogged Answers: The Evolution of Redux Testing Approaches
- Jan 18, 2021 - Blogged Answers: Why React Context is Not a "State Management" Tool (and Why It Doesn't Replace Redux)
- Jun 21, 2020 - Blogged Answers: React Components, Reusability, and Abstraction
- May 17, 2020 - Blogged Answers: A (Mostly) Complete Guide to React Rendering Behavior
- May 12, 2020 - Blogged Answers: Why I Write
- Feb 22, 2020 - Blogged Answers: Why Redux Toolkit Uses Thunks for Async Logic
- Feb 22, 2020 - Blogged Answers: Coder vs Tech Lead - Balancing Roles
- Jan 19, 2020 - Blogged Answers: React, Redux, and Context Behavior
- Jan 01, 2020 - Blogged Answers: Years in Review, 2018-2019
- Jan 01, 2020 - Blogged Answers: Reasons to Use Thunks
- Jan 01, 2020 - Blogged Answers: A Comparison of Redux Batching Techniques
- Nov 26, 2019 - Blogged Answers: Learning and Using TypeScript as an App Dev and a Library Maintainer
- Jul 10, 2019 - Blogged Answers: Thoughts on React Hooks, Redux, and Separation of Concerns
- Jan 19, 2019 - Blogged Answers: Debugging Tips
- Mar 29, 2018 - Blogged Answers: Redux - Not Dead Yet!
- Dec 18, 2017 - Blogged Answers: Resources for Learning Redux
- Dec 18, 2017 - Blogged Answers: Resources for Learning React
- Aug 02, 2017 - Blogged Answers: Webpack HMR vs React-Hot-Loader
- Sep 14, 2016 - How I Got Here: My Journey Into the World of Redux and Open Source
